
Why We Created the Strategic Performance Distance
A practical way to see where sales performance is in balance, where support is needed, and how teams can act before momentum fades.


You're Already Running Sales Builder Well
Metrics and weekly sessions give leaders a base, yet key questions remain: Who declined in the past month—trend or anomaly? Who needs support before momentum fades? Who is struggling silently?
A useful performance measure should help a team see where support is needed—not just who reached a number.
The activity data likely holds the insight you need, but pulling it out usually requires heavy technical effort and manual work. SPD surfaces that insight instantly, while still linking to the underlying details.
Understanding SPD in 60 Seconds
Think of SPD as a vital sign for sales performance. A score of 10 represents equilibrium: the agent has met all agreed targets. Thresholds can be tuned to suit a group. One reading guide is:
- 10.00 — equilibrium, with all agreed targets met
- Excellent — 9.5 or higher
- Warning — from 9.0 up to 9.5
- Alert — below 9.0
What SPD Looks Like in Practice
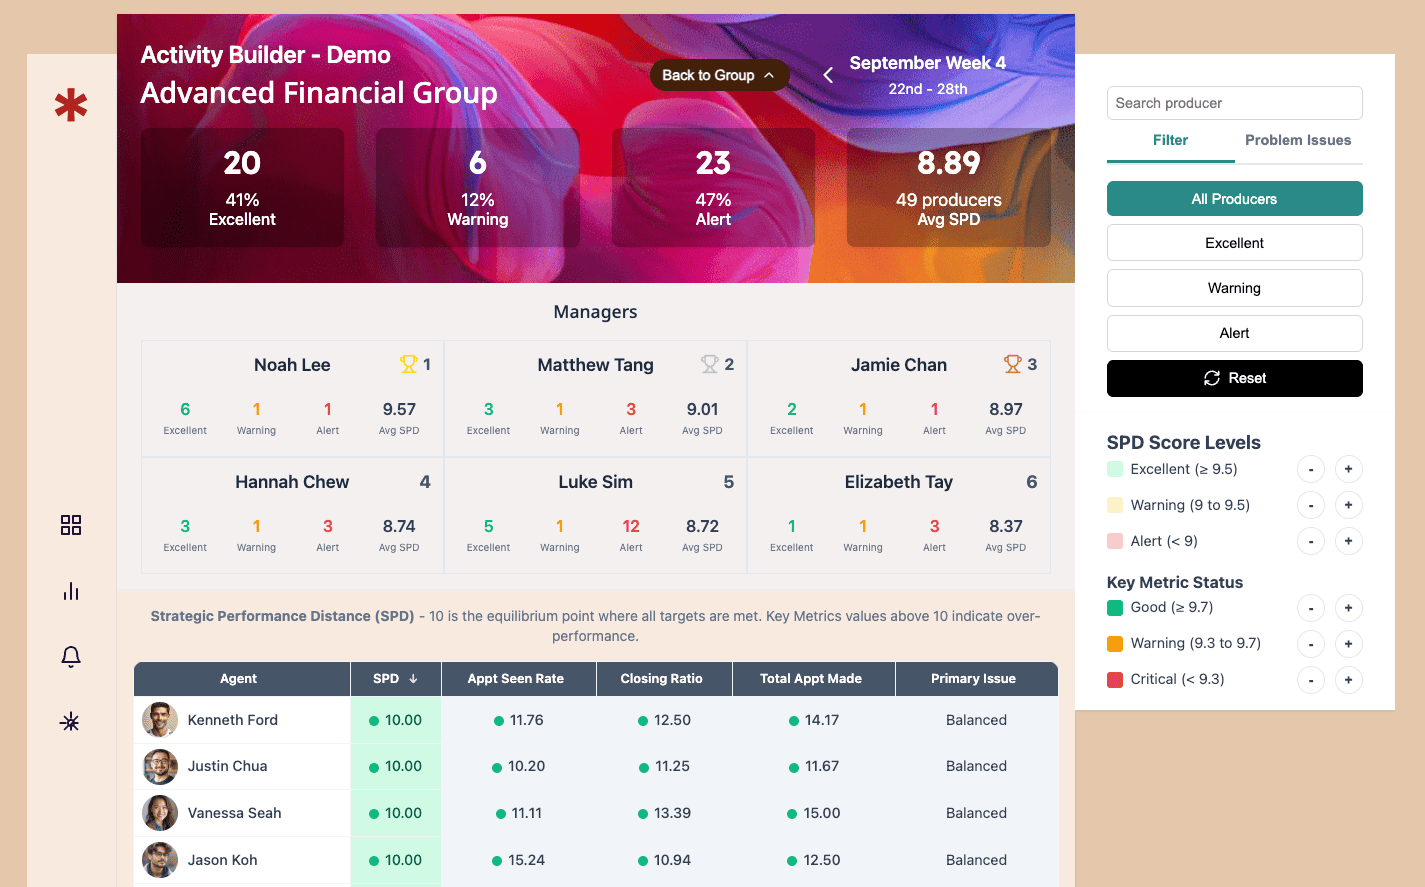
The group view shows 49 producers—20 Excellent, 6 Warning, 23 Alert—with an average SPD of 8.89. The figure below one of the manger Hannah Chew's team.
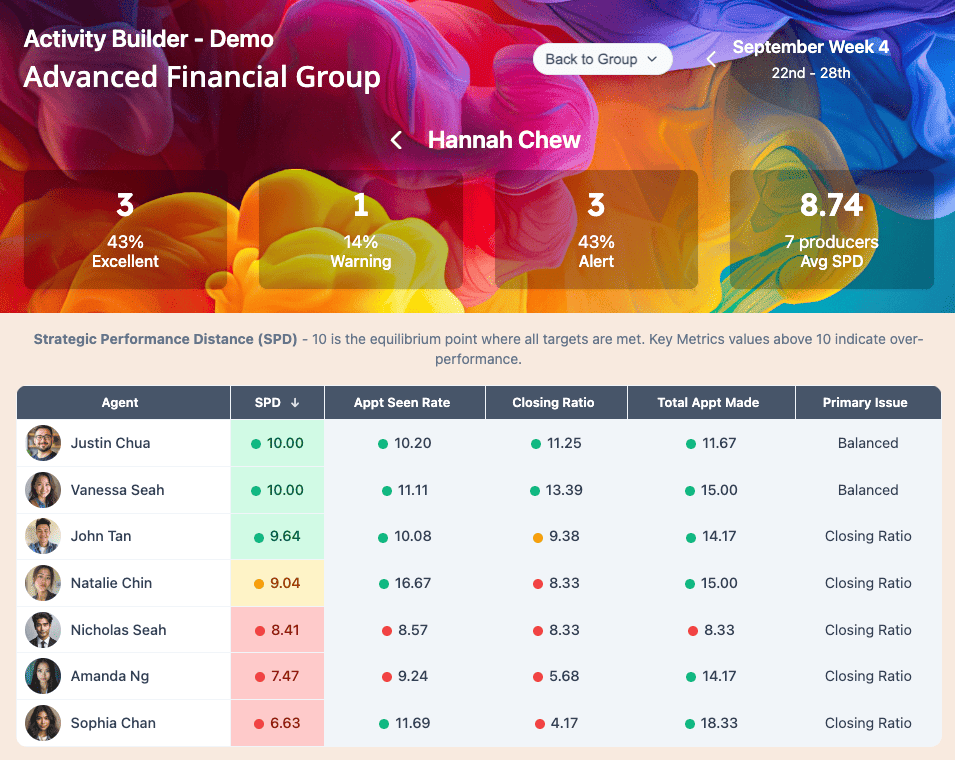
Closing Ratio is the primary issue for the flagged agents, signaling both team‑wide training and individual support needs. While the immediate time saved matters, the real value is identifying the skill that requires attention before planning sessions or broader decisions.
Identify the skill gap early, and the coaching conversation becomes a strategic advantage.
How SPD Works: The Design
Core principle: over‑performance in one area can’t cancel under‑performance in another. An agent at 150% of appointment targets but only 20% of closing‑ratio is still out of balance despite strong funnel activity.
Balance over isolated wins.
SPD tracks shortfalls against targets; over‑achievement adds no credit that could hide weaknesses. An agent reaches equilibrium only when every metric meets its target, making skill gaps obvious and giving leaders a clear team view.
Why Early Detection Matters
The value of SPD is not only the time saved in preparation. Earlier pattern recognition may help protect revenue and retain good people by making support possible before a challenge becomes entrenched.
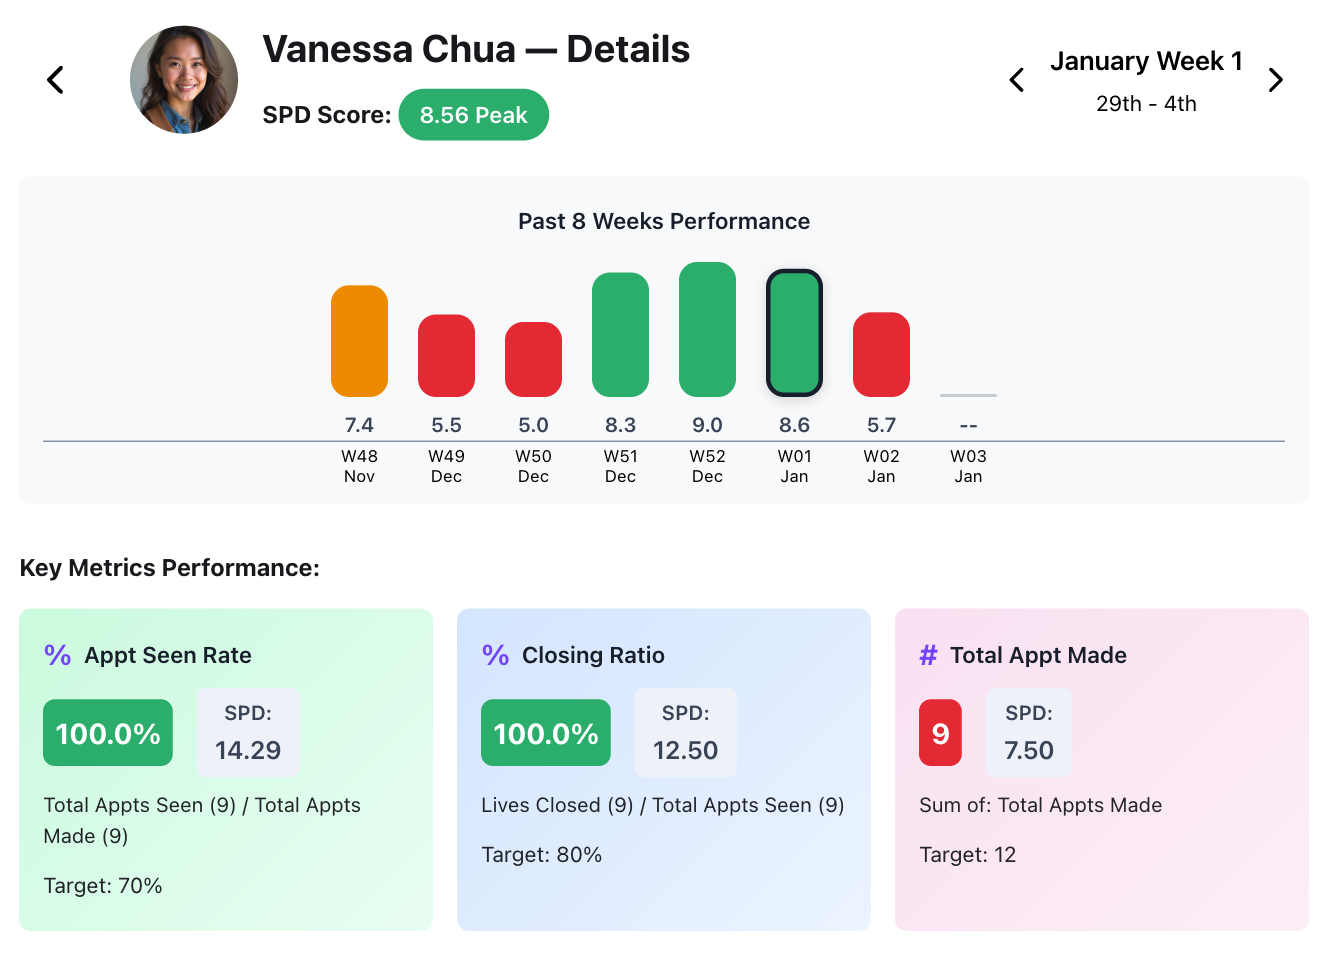
Four-week trends reveal what one meeting can miss
Consider Vanessa’s four-week view: Green, Green, Green, then Red. One difficult month in January may not call for concern. A pattern of Red readings over two months in May, however, may be a reason to check in early. The direction over time matters more than a single result.
In a Sales Builder session, success stories can naturally take up much of the conversation. A colleague who is struggling may remain unseen until the situation is harder to change. A four-week view helps make the pattern visible regardless of who speaks up, so support is based on a shared picture rather than session dynamics alone.
What Makes SPD Different
Self-correcting data
Funnel metrics help validate one another. If appointments are inflated, the closing ratio may fall and reveal the inconsistency. Trying to game one stage creates pressure at the next stage, making the whole picture harder to distort.
One number at every level
The same formula can describe one agent (for example, SPD 9.32) and an organisation of 150 agents (for example, average SPD 9.55). People at different levels can discuss performance using a shared measure and then open the underlying details when needed.
Built to evolve
Teams can weight metrics differently, adjust aggregation methods or update their sales-process templates as their work changes. The framework is designed to adapt without rebuilding the system from scratch.
Consensus Targeting: Trust Through Personalization
A high-net-worth specialist may set a target of six appointments a week, while a general-market agent may work toward twelve. Both can perform well against targets suited to their context, while the SPD formula stays the same.
The agent and leader set targets collaboratively, and Activity Builder records that consensus. Only the baseline changes; the measure does not. When both agents meet their agreed targets, each can reach SPD 10. Collaborative targets invite participation, build buy-in and help make the measure feel like a shared tool.
What We Expect: Rising Performance IQ
A shared vocabulary can create shared understanding. When agents can talk about SPD, Green Zone and Red Zone, they can begin to identify what is affecting their own score. “My closing ratio is pulling my SPD down” makes room for a more specific conversation than waiting for a leader to diagnose the issue.
That clarity can reduce the leader’s cognitive load while helping agents understand which activities to focus on, what support to request and which skills to develop. The leader’s role can shift from constant prompting toward strategic coaching. The intended gain is greater agent autonomy and a stronger learning culture.
What We Built: Activity Builder
SPD is embedded in Activity Builder, a platform designed for financial-services distribution rather than a generic CRM. It supports customizable templates for a group’s sales process, mobile-first real-time updates, a consensus-based target framework and twelve-week trends that can be reviewed without moving between multiple tabs.
The design intent is a coaching tool built around positive reinforcement: a clearer view to help agents and leaders decide what would help someone succeed.
Where This Leads
The aim is immediate clarity across different business models, without manual consolidation. The conversation can move from “Did you hit your target?” to “How can we help you succeed?”
Next Steps
For the mathematical foundations and game-theory framework behind SPD, read the whitepaper, “Strategic Performance Distance: A Nash Equilibrium-Inspired Framework for Sales Performance Management.”